
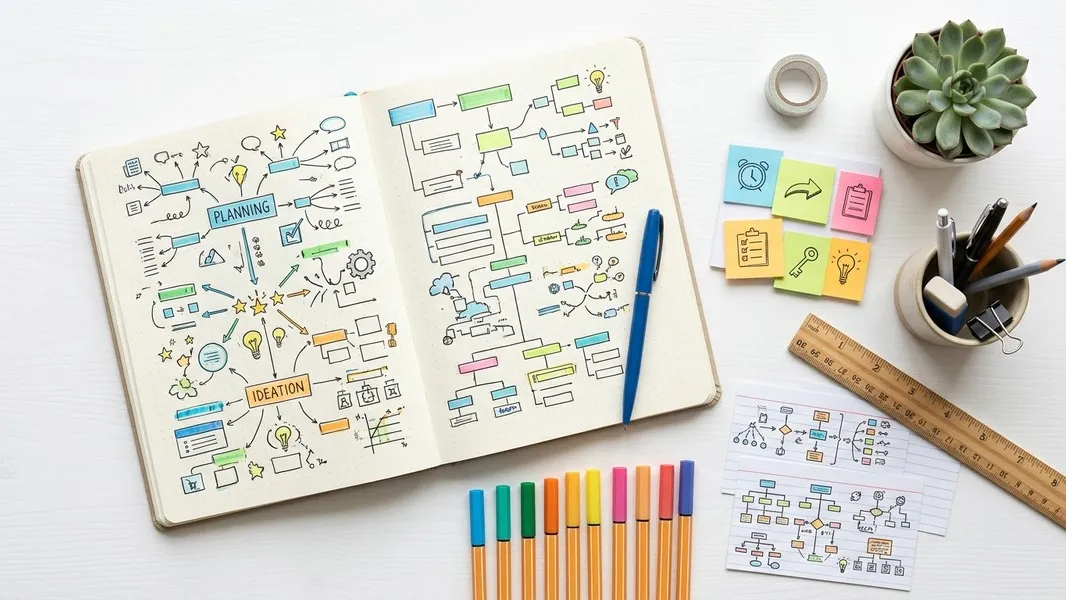
A visual learner is someone who understands and retains information best through sight-based representations: charts, diagrams, color-coded notes, concept maps, and videos rather than plain text or spoken explanation. If you find yourself drawing diagrams in the margins or needing to "see" a concept before it clicks, there's a good chance you process information visually.
Visual learning is one of the most commonly self-identified styles among students. But knowing you learn visually is only useful if you know what to do with that information. This guide covers what visual learning actually means, how to recognize your own tendencies, and which strategies produce measurable results.
What Is a Visual Learner?
A visual learner prefers to process new information through images, spatial arrangements, diagrams, and color rather than listening or reading dense blocks of text. The concept comes from the VARK model, developed by educational researcher Neil Fleming, which categorizes learners by preferred input mode: Visual, Auditory, Read/Write, or Kinesthetic.
Fleming makes an important distinction: visual in the VARK sense means preferring graphical and spatial representations, not just any visual content. A visual learner benefits from seeing how concepts relate to each other spatially. A densely worded slide deck, even if projected on a screen, is not the same as a diagram or concept map.
Understanding this distinction matters because it points you toward the right strategies. Color-coded notes and concept maps are genuinely visual tools. Watching a lecture video while taking linear notes is not.
Signs You Might Be a Visual Learner
There's no single definitive test, but certain patterns show up consistently. You tend to remember faces better than names, and places better than verbal directions. When someone explains a concept verbally, you instinctively want to sketch it out or draw a diagram. You notice when something looks "off" before you can articulate why, and you prefer flowcharts over numbered lists.
When reviewing notes, the pages with diagrams or color-coding feel easier to work through than pages of dense writing. You may find yourself redrawing your notes as a form of studying rather than just rereading what's already there.
Visual learners also tend to get more out of presentations or explanations that use visual aids, and they often find it easier to explain ideas to others by sketching something out rather than describing it in words. If teaching a concept "on a whiteboard" (real or imaginary) feels natural to you, that's a strong signal.
Most people are multi-modal: they learn through a mix of input types. The goal isn't to exclusively use visual methods, but to lead with them and supplement where other formats genuinely help.
How Visual Learners Process Information
Visual learners anchor new information to spatial and graphical structures. When information has a visible shape or layout, it becomes easier to place in memory and retrieve later. This connects to what cognitive scientists call the picture superiority effect: images are encoded more durably in long-term memory than words alone, a pattern extensively documented in memory research.
There's a critical distinction between active and passive visual engagement. Passively watching a diagram scroll by doesn't produce the same retention as actively constructing one. When you draw a concept map, color-code by category, or build a visual summary, you're forcing your brain to organize the information spatially rather than just receive it.
This explains why highlighting alone rarely improves performance: it's a passive visual act. Redrawing, mapping, and color-coding by category require active organization, which is what produces durable memory traces.
Study Strategies for Visual Learners
The strategies below work because they turn visual processing into an active encoding activity rather than a passive one.
Mind mapping is one of the most effective tools for visual learners. You start with a central concept and branch outward, connecting ideas spatially. The act of building the map forces you to decide how concepts relate to each other, which deepens encoding significantly. Mind mapping works best during review sessions after a lecture, not during the lecture itself.
Color-coding goes further than highlighting. Assign specific colors to categories: definitions in blue, examples in green, key dates in orange. Stick to those conventions across all your notes. Over time, color becomes a retrieval cue: seeing green activates your "example" memory pathway before you've even read the text.
Concept diagrams work where text falls short. For topics with multiple causes, relationships, or sequences, drawing a diagram forces you to work out the logical structure. Flowcharts work for processes; comparison matrices work for weighing options; Venn diagrams work for showing overlap between ideas.
The OAR method structures a full study session: start by visually overviewing the structure of your material (overview), then actively work through one section at a time by drawing, mapping, or color-coding it (act), then recall what you covered from memory (recall). Repeating this cycle deepens retention more than passive rereading.
Visual flashcards pair an image or diagram with a concept rather than text on both sides. The visual cue creates a stronger memory hook, especially for vocabulary-heavy subjects like anatomy, chemistry, or a foreign language. AI-generated flashcard decks, like those created by Primo Notes from uploaded PDFs or voice recordings, can serve as a starting point, with hand-drawn visual cues added during review.
Teaching back through drawing is another high-yield strategy. After studying a topic, try explaining it to someone else by sketching the concept from memory rather than pointing at your notes. The act of reconstructing the visual from scratch reveals exactly which parts of the structure you haven't fully encoded yet. Educational research consistently shows that retrieval through teaching accelerates long-term retention more than review alone.
Note-Taking Methods That Work for Visual Learners
Most standard note-taking advice defaults to linear formats: numbered lists, nested bullets, sentence summaries. Visual learners often find these difficult to review because they strip out the spatial structure that makes recall easier.
Sketchnoting replaces linear notes with a combination of diagrams, hand-drawn icons, and short text labels. During a lecture, instead of transcribing sentences, you capture the shape of the idea: arrows connecting concepts, sketched timelines, quick diagrams of processes. Sketchnotes look rough in real-time but become excellent review material because they preserve the visual structure of the content.
The mapping method builds a branching concept map directly from lecture content. Rather than taking notes line by line, you identify the central topic and build outward as the lecture progresses. This is harder to execute in real time but worth developing as a skill, since it produces review material that is immediately usable without reorganization.
Cornell notes, the two-column format, can be adapted for visual learners by reserving part of the right-hand column for diagrams and icons alongside written cues. Adding color to the summary row and visual markers in the cue column makes the format significantly more effective for review.
For students who are auditory learners, by contrast, verbal repetition and recorded lecture playback tend to outperform these visual formats.
AI Tools That Support Visual Learning
AI tools have changed what's practical for visual learners in two areas: mind map generation and flashcard creation.
Primo Notes generates AI mind maps directly from any captured content: voice recordings, uploaded PDFs, YouTube lecture URLs, or camera-scanned notes. Instead of building a map from scratch after a lecture, you capture the content and let the AI produce the initial structure, which you then review and annotate. The annotation step itself is an active visual exercise.
AI flashcard generation works on the same principle. Primo Notes processes notes or recordings and creates spaced repetition flashcard decks. For visual learners, the most effective approach is to supplement these cards with hand-drawn diagrams during review, using the AI-generated prompts as a base and adding visual cues manually.
Research on AI-supported mind mapping confirms that building spatial connections between concepts improves comprehension beyond linear review. One study found students using AI-generated visual aids achieved 90% mastery with stable retention weeks later, compared to control groups who struggled with the same material. The practical implication: AI tools are most useful for visual learners when they reduce the friction of starting a visual format, not when they replace the active engagement that makes it work.
The pattern is consistent across methods. Whether you're sketching concept maps, building color-coded note systems, or generating AI-assisted diagrams, the benefit comes from actively organizing the information into a form you can see and navigate. Passive visual consumption doesn't produce the same results.
Conclusion
Visual learners retain information best when they can see its structure: how concepts relate, how categories differ, how a process unfolds step by step. The shift that matters most is moving from passive visual consumption to active visual construction. Diagrams, mind maps, color-coded notes, and sketchnotes all work because they require you to organize information rather than simply receive it.
Knowing you're a visual learner means you can stop fighting formats that don't suit you and build study sessions around methods that do. Start with the strategy that feels most natural, use it consistently, and layer in AI tools where they reduce friction without replacing the active work that makes visual learning effective.